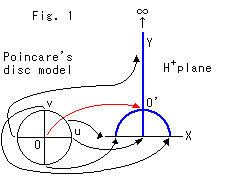
Let us think about infinity in relation to the upper half-plane ![]() and the horocycle that passes through the origin of Poincare's disk model.
and the horocycle that passes through the origin of Poincare's disk model.
Fig. 1 shows the correspondence of Poincare's disk model to the upper half-plane. This figure has been taken from the previous chapter. Look at the following pictures (Fig. 2 to Fig. 6) in succession.
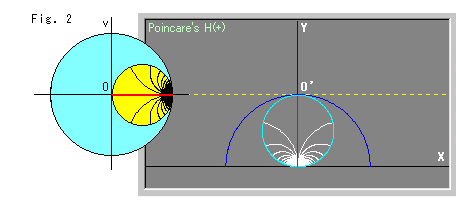
Look at Fig. 2. The sky blue circle O at the left is Poincare's disk model. The Yellow circle in the disk is a horocycle that passes the origin O. The black and red lines in the horocycle are radii at regular intervals measured on the circumference. We reproduce and transfer the horocycle to the upper Half-plane to the right. The sky blue circle is the circumference of the reproduced horocycle. The white and red lines are radii that correspond to those of the disk model. Every radius in the upper half-plane is a part of a semicircle. The yellow dotted line passing O' is the base line that is drawn parallel (Euclidean) to the X-axis.
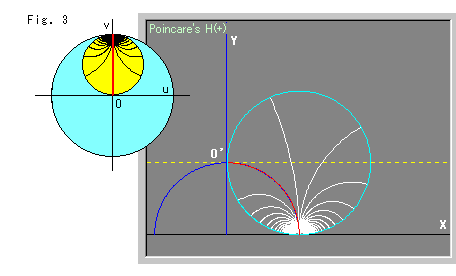
Let us turn the horocycle counter-clockwise around the origin O in the disk model.
In Fig. 3, the horocycle is turned 90![]() . In the upper Half-plane, the red radius is exactly on the blue semicircle, and the horocycle looks a little bigger.
. In the upper Half-plane, the red radius is exactly on the blue semicircle, and the horocycle looks a little bigger.
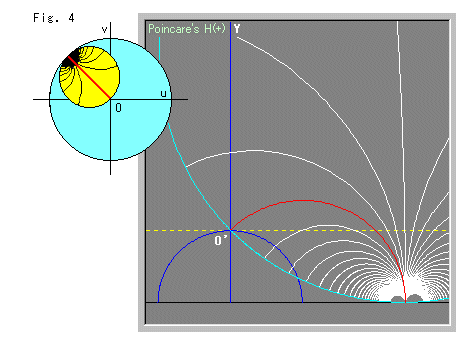
In Fig. 4, the horocycle is rotated by 3/4 ![]() . In the upper Half-plane, it gets considerably bigger.
. In the upper Half-plane, it gets considerably bigger.
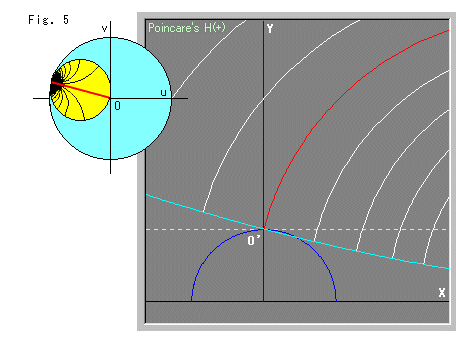
In Fig. 5, the horocycle is rotated by 11/12 ![]() (165
(165![]() ), which is a position close to 2
), which is a position close to 2![]() , and in the upper half-plane it gets very big. We cannot see the bottom of the horocycle, but we guess it certainly touches X-axis.
, and in the upper half-plane it gets very big. We cannot see the bottom of the horocycle, but we guess it certainly touches X-axis.
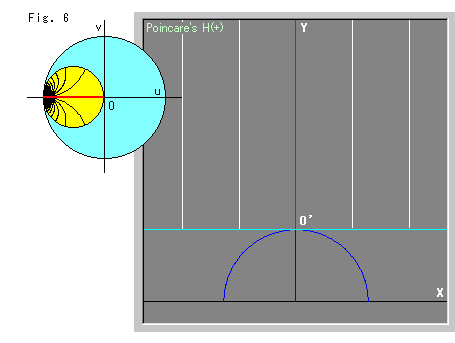
Now, look at Fig. 6. The horocycle in the upper half-plane exploded! Its circumference looks a straight line, and the radii look as if it is rising up vertically to infinity.
The horocycle is now the opposite of Fig. 2. The radii rising straight up are at regular intervals for our own eyes, too.
The upper half-plane is open in every direction, even below. The X-axis is a line lying at infinity below. Do not imagine the upper half-plane to be a rectangle.
When we compare the first horocycle in Fig. 2 with this last one in Fig. 6, we realize that in the disk model they are in reflection with respect to the v-axis but in the upper half-plane they are in inversion with respect to the blue semicircle (v-axis) as an inversion circle. As to an inversion, we will see later.
Now we directly move (slide) a horocycle along the X-axis. When we say "slide", we mean that we fix a point on the circumference of the horocycle to point O', and then drag the bottom of the horocycle (the hyperbolic center) along the X-axis.

Look at Fig. 7. The white spots on the circumference of the sky blue horocycle are points at regular intervals measured along the circumference from the top of the horocycle. The red spot at the bottom of the sky blue horocycle is the hyperbolic center that is always on the X-axis. The distance between each white spot and red spot is infinity, of course.
The yellow straight line is the bottom area of the circumference that is the inverted sky blue horocycle. The straight line radius of this circumference is now infinity. The white spots on the yellow circumference correspond to those of the sky blue horocycle.
The red curved line is a locus of the visual center of the sky blue horocycle. The center of the yellow horocycle goes along this locus, too.

Fig 8 shows the sky blue horocycle moved to the right a little. Notice the yellow line. It is no longer straight, and the white spots on it are not at regular intervals. The gray line is the trace where the yellow line was. The dark circle is the trace where the sky blue horocycle was.

In Fig. 9, we now see that the yellow line touches the X-axis. The contact point corresponds to the red point of the sky blue horocycle. So the contact point is the hyperbolic center and is colored red, too.

Fig. 10 shows that the yellow line became a circle without a doubt.
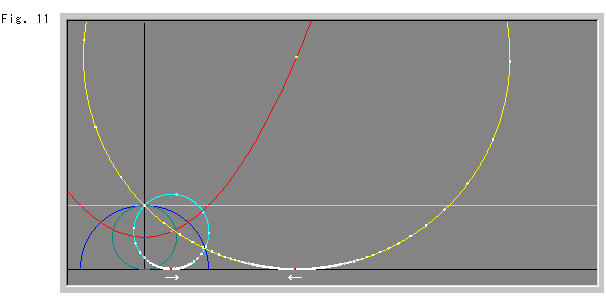
In Fig. 11, the visual center of the yellow horocycle came down from the open top of the upper half-plane.
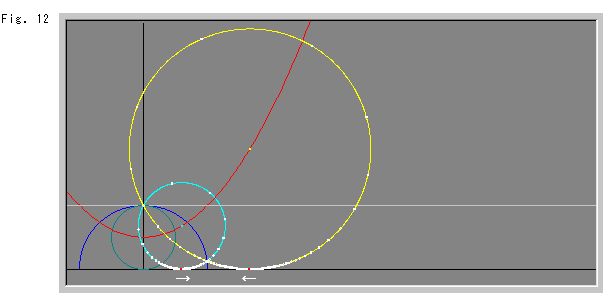
In Fig. 12, the yellow horocycle appeared in its entirety. It is truly a circle.
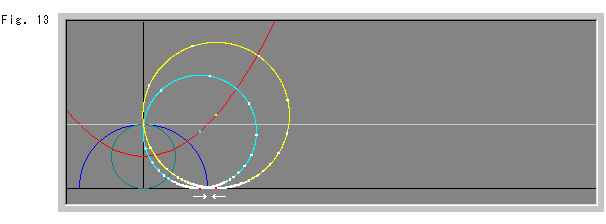
In Fig. 13, the visual centers of the sky blue horocycle and the yellow horocycle drew closer to each other. As we have seen, the two circles always intersect each other on the blue inversion circle. It is natural due to the characteristics of inversion.
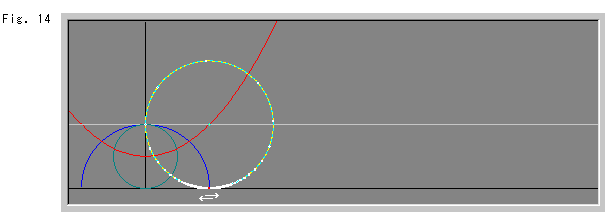
In Fig. 14, the two horocycles are doubled. It is the same as no inversion. But the inside and outside of the blue inversion circle are exchanged, and now the size of the dual horocycle is the same as that of the blue inversion circle.
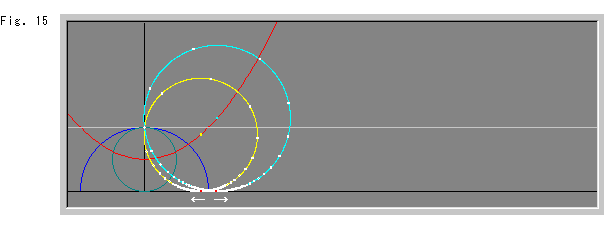
Fig. 15 shows that the two horocycles are passing each other with their red spots on X-axis.
To see what happens next, all we have to do is exchange the colors of the two horocycles and turn the arrows in the opposite direction. The result is that we go up in reverse sequence from Fig. 15 to Fig. 7.
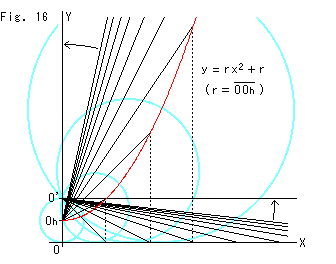
Fig. 16 shows when we setp back from Fig. 15 to Fig. 7. The red curve is the locus of the visual center of a horocycle. Let's follow it. The expression in the figure is written provided that the upper half-plane is an ordinary plane. That is to say, the locus of the visual center of a horocycle is a quadratic curve when we look at the figure as an ordinary diagram rather than a curve in the upper half-plane.
We draw lines from the first visual center ![]() of the horocycle to points equally spaced in ordinary scale on the X-axis where the bottom of the horocycle is dragged. Also, we draw lines from the first upper end point O' of the horocycle to points on the red curve that correspond to point on the X-axis. The visual center climbs up the red curve when the bottom of the horocycle goes to the right. The sky blue circles are horocycles that show this situation.
of the horocycle to points equally spaced in ordinary scale on the X-axis where the bottom of the horocycle is dragged. Also, we draw lines from the first upper end point O' of the horocycle to points on the red curve that correspond to point on the X-axis. The visual center climbs up the red curve when the bottom of the horocycle goes to the right. The sky blue circles are horocycles that show this situation.
What will happen when the visual center of the horocycle climbs unlimitedly up the red curve? The red curve is a quadratic line in ordinary scale. A quadratic line has no asymptotic line. But its tip is now at infinity right above point ![]() . So the result is that the visual center of the horocycle is now at infinity right above, too. The radius of the horocycle is now infinitely long.
. So the result is that the visual center of the horocycle is now at infinity right above, too. The radius of the horocycle is now infinitely long.
On the other hand, the bottom of the horocycle seems, by looking at Fig. 16, to be currently moving to the right toward infinity in a straight line. But, what is the truth? Look at Fig. 1 again. The X-axis corresponds to the edge of the disk model. That is, the real X-axis is not a simple straight line. It passes the infinite right, the infinite left and the infinite upward.
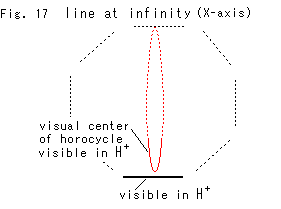
Fig. 17 is an imaginal illustration to show this situation. Both the visual center and the bottom (hyperbolic center) of horocycle are at infinity top now. This is the situation in Fig. 7.
But this illustration is selfishly made, and we have no evidence yet.
Let us review what we have thought.
Since the upper half-plane is open in every direction as well as the disk model, both of the visual center and the bottom of horocycle can never reach a point at infinity. However, if we assume that they arrived at infinity, it seems not unreasonable for us to guess that the situation becomes as shown in Fig. 7. When we say that "Fig. 7 is fictional", we are saying it based on this idea.
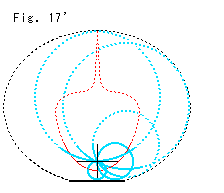
Fig. 17' is drawn adding horocycle to Fig. 17. The locus of the visual center looks strange in shape but it must be parabolic.
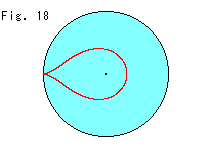
Fig. 18 is a reproduction of the red quadratic line that is expanded in the upper half-plane to infinity. It is similar to that of Fig. 17', isn't it? It is natural because the upper half-plane and the disk plane describe the same hyperbolic plane functionally. (The visual center of the horocycle in the upper half-plane does not correspond to the visual center of the horocycle in the disk model.) Looking at Fig. 17, we cannot be sure if the locus is really a loop or not.
What will happen after we get back to Fig. 7? When we rote the horocycle more counterclockwise on the disk model in Fig. 6, the corresponding horocycle on the upper Half-plane will entirely appear in our site from left top and will come down.
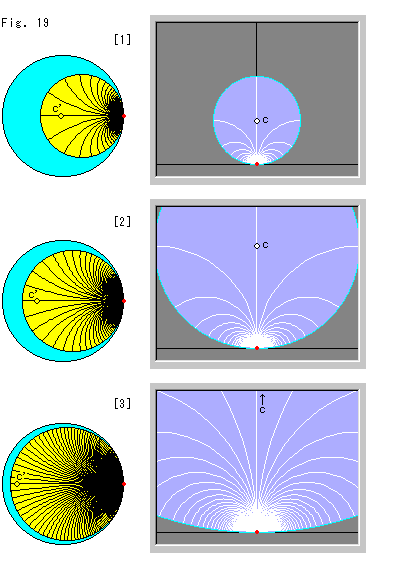
Now we will raise the visual center of the horocycle in the upper half-plane with the red bottom of horocycle fixed on the X-axis.
Look at Fig. 19. The figures on the left are Poincare's disk models. Each of their horocycles corresponds to that of the upper half-plane to their right. The small spot c' in the disk model corresponds to the visual center c of the horocycle in the upper half-plane. Radii are at regular intervals along the circumference of the horocycle, measured from the fixed point to points opposite the fixed point.
A horocycle is infinitely large whether it is drawn large or small, but we can say large or small for finite objects within an infinite object.
[1]: We raised the visual center c of the horocycle in the upper half-plane. In the disk model, the horocycle grew to the left and looks big.
[2]: We raised the visual center c of the horocycle even higher.
[3]: We raised c upward very much, but it has not yet arrived at infinity. In the disk model, point c' looks nearby the model edge.
If the visual center c of the horocycle goes up to infinity, what will happen? It is impossible to measure distance along the X-axis or the disk model edge. The horocycle occupies the whole area of the upper half-plane and the disk model. We see that the hyperbolic center of the horocycle is missing. Not only that, the red bottom that is only a point of contact with the X-axis, the visual center c and its corresponding point c' are meaningless because the circumference of the horocycle is entirely open now, though it was open before only at the red spot. Naturally, we cannot draw radii.
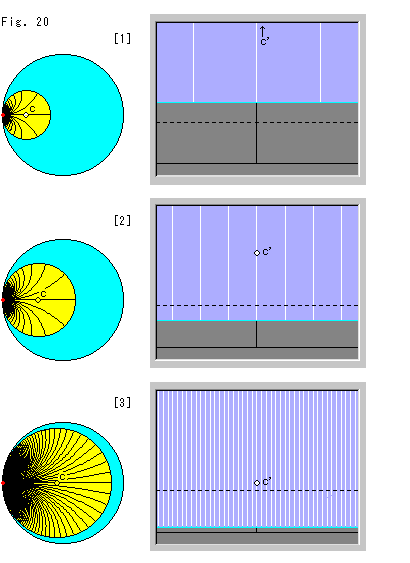
Look at Fig. 20. Similar to Fig. 19, every horocycle in the disk model and the upper half-plane corresponds to each other together with the radii. The left end of the disk model corresponds to the upper infinity of the upper half-plane. Next, we fix a point on the circumference of the horocycle. This fixed point does not appear in the upper half-plane we draw. We mark the visual center in the disk model as c (without a prime "'") and its corresponding point in the upper half-plane as c'. We move the visual center c in the disk model to the right (lowering it in the upper half-plane).
The black dotted line in the upper half-plane is the base line (Y = 1). The space between adjacent radii is the same as that of Fig. 19.
[1]: The visual center c of the horocycle in the disk model moved to the right, and the bottom of the corresponding horocycle in the upper half-plane came down visually (to our eyes). In the upper half-plane, point c' (which corresponds to point c) is still far upward. The white radii are at regular intervals and they appear to be extended straight upward. The actual hyperbolic width of each interval gets narrower as we observe them upward though they are visually unchanged. The actual hyperbolic width of the black radii in the yellow horocycle also get narrower than visually observed when they get close to the edge of the disk model. Remember our hyperbolic ruler.
[2]: We moved the visual center c of the horocycle in the disk model more to the right. The width of the white radii in the upper half-plane looks narrower, but it is the same as that of [1] for hyperbolic width.
[3]: We pushed the visual center c close to the center of the disk model. In the upper half-plane, the corresponding point c' gets close to the dotted base line.
When the visual center c of the horocycle in the disk model reaches the center, the situation will be the same as that of [3] in Fig. 19, and the hyperbolic center of the horocycle cannot be defined.
Now we realize that the circumference of the disk model is also a straight line and that the X-axis of the upper half-plane is also a circle.