There are "metric" and "curvature" to describe the curving degree of space. Here we see the metric.
Lobachevsky and J. Bolyai were not accepted while they were living. Why? Is it because they said bizarre and mysterious things?
They began by considering the Parallel Postulate. They said that parallel lines would meet each other at infinity (where we can never get to). Also they said that angle and distance depend on each other. Accepting this requires us a considerable degree of intellectual compromise. Above all, they did not prove the non-contradiction of their geometry. What they did was merely demonstrate hyperbolic trigonometry.
Today, mathematicians are studying hyperbolic geometry with a model. Though their subjet is hyperbolic geometry, they actually use Euclidean geometry provided that hyperbolic trigonometry or like should be applied. And it is often said that the hyparbolic geometry is not contradictory as long as Euclidean geometry is contradictory. Also that there are actual results for the past 2000 years though the no proof has been done. Or that it is impossible to prove the non-contradiction of Euclidean geometry. It is based on so-called Godel's Proof of Impossible. But we do not know it at all. Well, nothing is clear for us.
We have neither ability nor interest to make research for absolute truth or perfect logic. It is enough for us to get passable understanding. Be that as it may, things are still not so clear though we have seen a variety of things in our study so far, are they?
Riemann's idea is completely different from that of Lobachevsky. It was not Riemann's concern to study whether hyperbolic geometry is contradictory or not. He began with the investigation of space, and he made steady progress. He did not develop anything that was based upon unclear fantasies or assumptions. With no relation to the parallel axiom, Riemann sought to delve into the idea of just what types of space can exist, and he showed us that one type of space is hyperbolic space. Thanks to Riemann, the Hyperbolic Non-Euclidean World became neither a monster nor a heretical teaching.
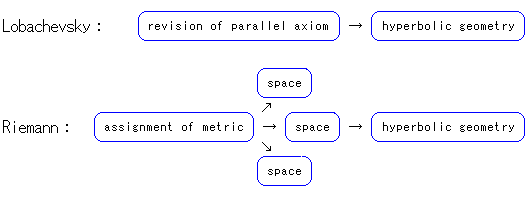
We can think of a curved space just as we think of a curved surface that can be made from a flat surface (plane). Curved space also appears in Einstein's theory of relativity. We (people in the Euclidean world) can grasp the concept of the Hyperbolic Non-Euclidean World as a curved space. The man who showed it to us was Riemann.
The weapon for Riemann's idea is so-called Gauss' differential geometry. Let us concentrate, as usual, on the fruits of this geometry without going into the actual concept in great detail.
Metric is a microscopic ruler. Our metric is not like something we use in daily life, such as a cup. On a Euclidean plane it is described as

See Fig. 1, for example. The red straight line is in Euclidean space. Let us measure the ordinary length S between points ![]() and
and ![]() .
.
An expression of the line is
We can easily calculate the length S by applying the Pythagorean theorem, but we will rely on formula (1) instead. First, we differentiate both sides of expression (2) and get ![]() . Then we substitute it in formula (1). Then, after rearrangement, we get
. Then we substitute it in formula (1). Then, after rearrangement, we get
When we integrate this, we finally obtain the length S as
in Euclidean space.
Metric (ruler) in a plane other than Euclidean plane is different from formula (1). Metric on the upper half-plane ![]() is
is

This tme, it is somewhat complicated since the denominator has y. This 1/y is a weight added to Euclidean metric. It is a degree of difference from Pythagorean theorem. We may say that a weight is the density of length. A curved space is a space with a weight other than 1.
Let us see how the weight works. We can easily integrate formula (5) if y = ax + b, and the hyperbolic length S between 2 points (![]() ,
,![]() ) and (
) and (![]() ,
,![]() ) is
) is

If x or y is constant,

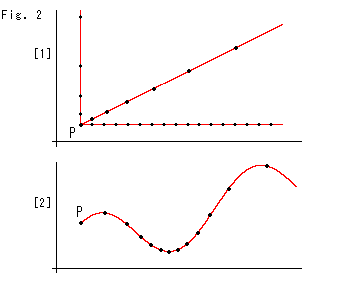
Look at Fig. 2.
We draw lines on the upper half-plane ![]() .
.
[1]: We draw three red visually straight lines from point P. Black spots are at hyperbolic regular intervals from point P. Formulae (6), (7) and (8) are used. All the hyperbolic gaps of black spots are the same, but they looks different. It depends on distance from X-axis. Every gap of black spots on the visually horizontal straight line is the same wherever. Needless to say, red lines are not a hyperbolic straight straight line except vertical one.
[2]: It shows a curved line with equally spaced black spots. The spots gather where the curve gets closer to X-axis.
It is convenient if we have a curved ruler to accurately measure the length of a curved line. Formula (5) is a rule for making a curved ruler that fits in curved space, and formulae (6), (7) and (8) are curved rulers for measuring a concrete object. "Curved" means not only actually curved but also a visually straight object with deformed density in length. To measure the latter we have to use a ruler with a deformed scale.
To know how metric works concretely let us see some topics.
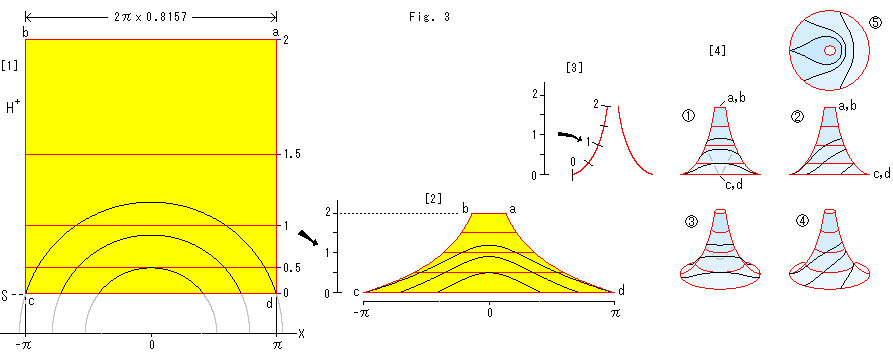
Look at Fig. 3 above.
We make a pseudosphere from the upper half-plane ![]() , and see how "weight" works.
, and see how "weight" works.
[1]: The yellow area abcd is to cut out for a pseudosphere. The horizontal width is 2![]() at X-axis. The hyperbolic width at the top end is not 2
at X-axis. The hyperbolic width at the top end is not 2![]() but it is multiplied by about 0.8157. Line S that is located at Euclidean distance 1 from X-axis is our standard for vertical hyperbolic distance. We draw three semicircle on X-axis as examples of hyperbolic straight lines.
but it is multiplied by about 0.8157. Line S that is located at Euclidean distance 1 from X-axis is our standard for vertical hyperbolic distance. We draw three semicircle on X-axis as examples of hyperbolic straight lines.
[2]: We press the yellow rectangle abcd in X-direction and Y-direction so that we get actual hyperbolic length on our plane. The new plane is a hill-shaped abcd. And the three black circle arcs are deformed as shown. As far as X-direction and Y-direction are concerned, hyperbolic length is transferred to a Euclidean plane. However, we do not know what will hapen in another direction.
By the way, we pulled and spreaded out a disk model to get a real hyperbolic plane in our Euclidean field (Ch. 16). But here, to the contrary, we compressed the upper half-plane ![]() . Yes, our way is inverse. But in hyperbolic geometry X-axis is located at infinity. Therefore, if we make a rctangle at the opposite side of [1], we shall have to pull it down.
. Yes, our way is inverse. But in hyperbolic geometry X-axis is located at infinity. Therefore, if we make a rctangle at the opposite side of [1], we shall have to pull it down.
[3]: Now we make a pseudosphere by gluing sides ad and bc. The length of its girth is OK just as it is. But the length of the generator of pseudosphere must be equal to the height of hill abcd. So we compress more in the Y-direction to meet it.
[4]: They are pseudospheres we made.
![]() : Since we made the pseudosphere from hill abcd, its has no long tail.
: Since we made the pseudosphere from hill abcd, its has no long tail.
![]() : It is the side view of
: It is the side view of ![]() .
.
![]() ,
, ![]() : They are tilted to us a little.
: They are tilted to us a little.
![]() : It is the view of
: It is the view of ![]() .
.
Thus we got what is called pseudosphere out of the upper half-plane ![]() . Both are models. But the former has only a condition that we should regard a geodesic line on the curved surface as a straight line. We can measure length on the surface by an ordinary ruler. Then, what about "weight"?
. Both are models. But the former has only a condition that we should regard a geodesic line on the curved surface as a straight line. We can measure length on the surface by an ordinary ruler. Then, what about "weight"?
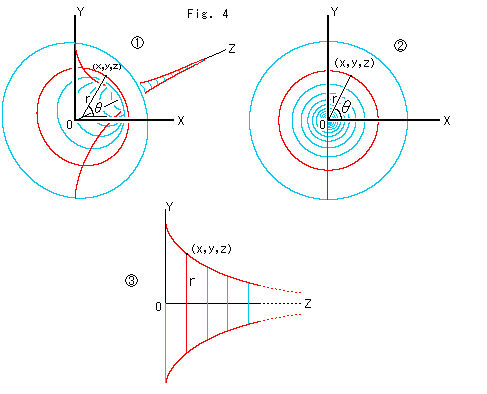
Look at Fig. 4.
It shows geometric a point (x, y, z) and r,![]() on the psudosphere.
on the psudosphere. ![]() is the slant view of inside of the opening.
is the slant view of inside of the opening. ![]() is the view in parallel with Z-axis.
is the view in parallel with Z-axis. ![]() is a side view.
is a side view.
Now the pseudosphere. Its expression is

It is in Euclidean space, so that we can imitate formula (1) and describe the metric as
But we cannot find the weight in this (9). We apply the relations of x, y and z on psudosphere, and rewrite formula (9) by using polar coodinates (r,![]() ). Then
). Then
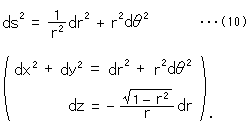
This (10) is described with 2 letters only. Now we make a change of variable r as
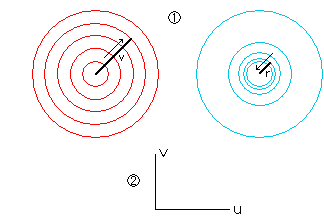
And also we change letter ![]() to u. Then we get
to u. Then we get
Isn't this the same form as the metric of the upper half-plane ![]() , which is formula (5)! Yes, it is. This uv-plane is nothing but the upper half-plane. However, to cover the entire upper half-plane
, which is formula (5)! Yes, it is. This uv-plane is nothing but the upper half-plane. However, to cover the entire upper half-plane ![]() we have to remove the restriction on u,
we have to remove the restriction on u, ![]() . But if we change the upper half-plane back to the pseudosphere, we will get a multi-layer Pseudosphere as we saw it in Ch. 18. Therefore, as to one-to-one mapping, we still need the restriction
. But if we change the upper half-plane back to the pseudosphere, we will get a multi-layer Pseudosphere as we saw it in Ch. 18. Therefore, as to one-to-one mapping, we still need the restriction ![]() .
.
In figure right ![]() shows relation between v and r as radii, and
shows relation between v and r as radii, and ![]() shows v-axis for uv-plane.
shows v-axis for uv-plane.
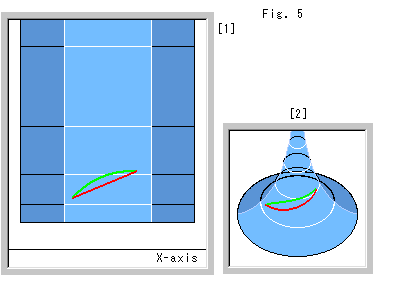
Look at Fig. 5.
We saw the state of a straight line on the pseudosphere in chapter 18. Now we see it in relation with the upper half-plane ![]() . The metric of pseudosphere is expressed as formula (9). But there is no ordinary straight line on the pseudosphere because we regard its surface as plane and a geodesic as a straight line.
. The metric of pseudosphere is expressed as formula (9). But there is no ordinary straight line on the pseudosphere because we regard its surface as plane and a geodesic as a straight line.
[1]: The red visual straight segment is drawn in the upper half-plane ![]() . The green line is the hyperbolic segment (circular arc) that passes both ends of the red segment.
. The green line is the hyperbolic segment (circular arc) that passes both ends of the red segment.
[2]: It is a corresponding state on the pseudosphere with red and green segments. As you see, the red sgment is actually bent. The green segment looks curved a little but it is a geodesic. (The drawing scale of [2] is about double compared with [1].)
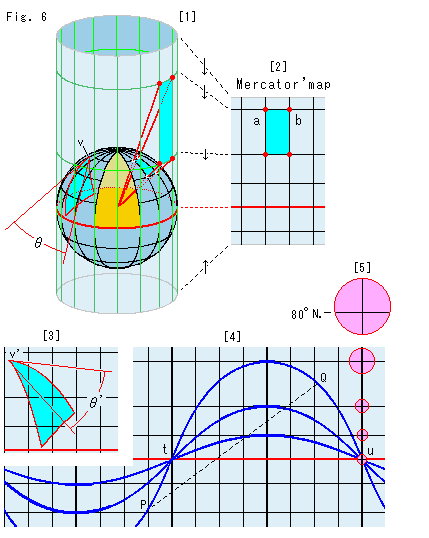
Look at Fig. 6.
Let's take a world map for a topic. There are many kinds of world maps, among which Mercator's is the most popular and useful. Every type of map has its own method of measuring distance (metric). It corresponds that every model has a different metric for the same substance. (Various world maps are shown on interet Cartographical Map Projections.)
[1]: It is a cylindrical projection, which we saw in Chapter 4. To get an accurate Mercator map, we compress it vertically a little as shown by the arrows.
[2]: It is Mercator's map. that is an. We unrolled cylinder of [1] and look its outside. If we see the inside of cylinder, it resuls that we are seeing the surface of eath from its inside. Both the latitude (parallels) and longitude (meridians) on the map are at intervals of ![]() /8. It is the metric digitalized and visualized for our eyes, is't it?
/8. It is the metric digitalized and visualized for our eyes, is't it?
Evrybody knows that visual distance on this map is not actual. A gap between meridians on the equator is about 2500 Km, but it gets narrower in a high latitude. Distance between points a and b in latitude 67.5![]() is only 950 Km or so. Gaps of latitude look bigger the higher they are, but they are actually equal as degrees of latitude.
is only 950 Km or so. Gaps of latitude look bigger the higher they are, but they are actually equal as degrees of latitude.
As for the angle, it is what is called conformal mapping. The relation in angles between the pseudosphere and upper half-plane ![]() is also conformal mapping. An intersectional angle of two curved lines on the sphere (globe) agrees with that of the map. It is not a direction angle on the map measured with a straight ruler.
is also conformal mapping. An intersectional angle of two curved lines on the sphere (globe) agrees with that of the map. It is not a direction angle on the map measured with a straight ruler.
[3]: The sky blue triangle is transferred from the sphere. The original triangle on the sphere is formed with great-circle routes, that is a spherical triangle. The vertex v is moved to the map as vertex v'. Angle ![]() at vertex v equals
at vertex v equals ![]() ' at vertex v'. The other vertices correspond similarly. The sum of the interior angles of the triangle on the map is greater than
' at vertex v'. The other vertices correspond similarly. The sum of the interior angles of the triangle on the map is greater than ![]() because that of the spherical triangle is greater than
because that of the spherical triangle is greater than ![]() . It is due to conformal mapping, though the triangle on the map looks enlarged and deformed. This is the biggest reason why a Mercator map is useful.
. It is due to conformal mapping, though the triangle on the map looks enlarged and deformed. This is the biggest reason why a Mercator map is useful.
[4]: The blue lines are great-circle routes that connect 2 points t and u on the equator, which are familiar with us. Points t and u are antipodal points (end points of the diameter of a sphere) on the equator. They look like sine curves, but it is not true. They slant at the red equator by intervals of ![]() /8. Meridians and the equator are also great-circle routes. The distance along any of great-circle route from point t to point u are the same though they look so much different. A straight line like the dotted line PQ on the map is called a "rhumb line". We can reach our destination without fail if we sail along the rhumb line. It is the easiest for navigation, and another advantage of a Mercartor map, though we waste time because it is not a great-circle route.
/8. Meridians and the equator are also great-circle routes. The distance along any of great-circle route from point t to point u are the same though they look so much different. A straight line like the dotted line PQ on the map is called a "rhumb line". We can reach our destination without fail if we sail along the rhumb line. It is the easiest for navigation, and another advantage of a Mercartor map, though we waste time because it is not a great-circle route.
[5] shows how equal-size areas appear larger the higher the latitude lines are. The area in latitude 80 degrees north is about 35 times as large as that in the equator. The center of the biggest pink circle is obviously tilted down.
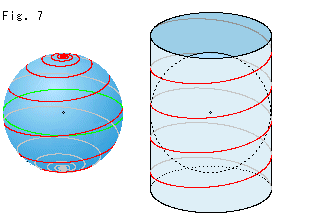
Look at Fig. 7.
If we travel steadily and straightly on the map while keeping constant (not horizontal nor vertical) slope (i.e., along the rhumb line), we will get closer to the north or south pole. But we never get to either pole unless we make an infinite number of revolutions. We can see the situation by rolling the map in the shape of cylinder. A Mercator map is a map that expands the finite surface of the globe to an infinitely wide plane in the vertical without an edge. The upper half (over the equator) of a Mercator map is quite similar to the upper half-plane, isn't it? The actual substance of a world map is our spherical earth. If only we have the map, we can grasp the actual substance even if it is invisible. This similar to the relation between the actual substance of hyperbolic plane and its mode.
Let us go back to the metric.
A solid body is usually described with three letters x, y and z. For example, ![]() for a sphere with radius 1. But two letters are enough if we are interested in surfaces only. A Mercator map uses two letters (the latitude and longitude) for the globe. There are several ways to describe the same surface of a solid, just as we have many types of the world maps. To describe an object with two letters means to make the surface a plane.
for a sphere with radius 1. But two letters are enough if we are interested in surfaces only. A Mercator map uses two letters (the latitude and longitude) for the globe. There are several ways to describe the same surface of a solid, just as we have many types of the world maps. To describe an object with two letters means to make the surface a plane.
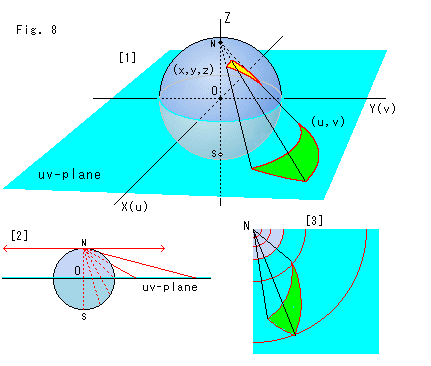
Look at Fig. 8.
This is called a "stereographic projection", which is one method of moving a point (x, y, z) on a sphere to a point (u,v) on a plane. There is another stereographic projection, in which a sphere is placed on uv-plane, but here we locate uv-plane on the equator-plane. The uv-plane is equivalent to the celestial equator-plane. Points on the sphere are projected to uv-plane by projection from the north pole N.
[1] shows that the projected triangle from the sphere gets bigger and distorted. But this projection is also a conformal mapping, and each vertex-angle is unchanged between the sphere and uv-plane.
[2] shows the sphere viewed along the X(u) axis with the uv-plane leveled. Projected lines are slanted at intervals of 30![]() from the horizon. (The left side is omitted.) Points on the northern hemisphere move to the outside of the equator on uv-plane, and points on the southern hemisphere move to the inside of the equator on uv-plane. When we turn the projected line up to the horizon (z = 1), the corresponding point looks like it stays at a point at right infinity, but remember that a point at infinity does not have any fixed location. The red arrows are just for illustration. Values of u and v are not limited at all, though the absolute values of x, y and z must be equal to or less than 1.
from the horizon. (The left side is omitted.) Points on the northern hemisphere move to the outside of the equator on uv-plane, and points on the southern hemisphere move to the inside of the equator on uv-plane. When we turn the projected line up to the horizon (z = 1), the corresponding point looks like it stays at a point at right infinity, but remember that a point at infinity does not have any fixed location. The red arrows are just for illustration. Values of u and v are not limited at all, though the absolute values of x, y and z must be equal to or less than 1.
[3] shows a bird's-eye view of part of [2]. ([2], [3] are scaled to 1/2 of [1].)
Let the radius of the sphere be 1, to keep things simple. Then, the metric (linear element ds) on uv-plane is expressed as follows by using what is called "the first fundamental form of differential geometry".

This uv-plane is a plane with spherical character. When we measure length on uv-plane with this metric, we can get the length on a sphere.
We compare expression (1) with expression (12), and shade different part of the latter as

The extraction of shaded part, ![]() is the weight.
is the weight.
Then, contrary to the sphere, what will happen if we exchange the plus symbol for the minus symbol as follows.

We may call this new plane "a plane with inverse-spherical character" or "antisphere". New uv-plane with this metric is not infinitely spreaded out like [1] of Fig. 8 but limited within a circle with radius 1. (It would be negative metric ds if ![]() .)
.)
Truly, this is the metric of Poincare's disk. We promise that we regard a geodesic measured with this metric as a straight line, and we add this promise to the plane with inverse-spherical character. Then the plane becomes a model that can be regarded as an actual hyperbolic plane. The model, in this case, is Poincare's disk.
The weight 1/y in formula (5) of the metric in the upper half-plane and the weight ![]() in formula (13) of Poincare's disk are different. It is because weight is set on each model, not to describe the curving degree of the hyperbolic plane itself.
in formula (13) of Poincare's disk are different. It is because weight is set on each model, not to describe the curving degree of the hyperbolic plane itself.
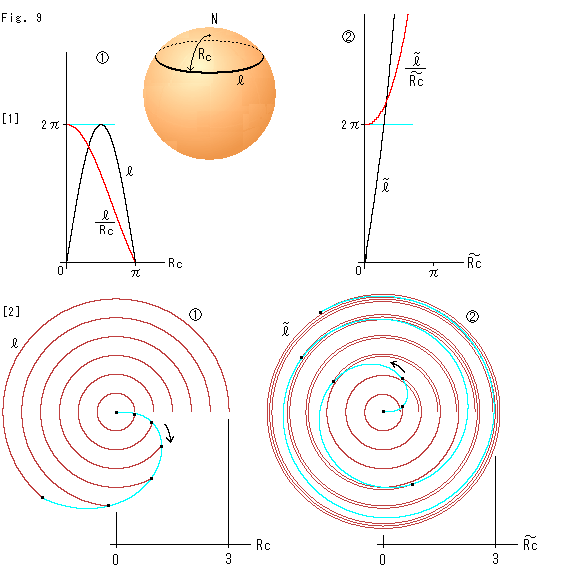
Look at Fig. 9.
Frankly, expression (13) does not make sense for us, does it? Let us try to see what we called antisphere through our own eyes.
[1]: Let us see it by graphs.
![]() : The black curve in the diagram shows that the circumference
: The black curve in the diagram shows that the circumference ![]() of the circle on a sphere gets bigger once and then shrinks when the radius Rc is enlarged. The red curve shows the ratio of the circumference
of the circle on a sphere gets bigger once and then shrinks when the radius Rc is enlarged. The red curve shows the ratio of the circumference ![]() to increasing radius Rc every moment, though the ratio in an ordinary plane is always the constant value of 2
to increasing radius Rc every moment, though the ratio in an ordinary plane is always the constant value of 2![]() .
.
It is worthy of notice that this character never change wherever we choose the starting point on a sphere.
Then, what about an object that its circumference grows endlessly when the radius enlarges at a point anywhere? It has a counter character to that of the sphere. Needless to say, it is a hyperbolic plane. We can not raw such object, can we?
![]() : But by graph, we can easily draw it. Both
: But by graph, we can easily draw it. Both ![]() and
and ![]() are hyperbolic length. The graph
are hyperbolic length. The graph ![]() is drawn by using a hyperbolic model. It is based on the same idea as
is drawn by using a hyperbolic model. It is based on the same idea as ![]() . Any hyperbolic model will naturally do for the graph
. Any hyperbolic model will naturally do for the graph ![]() . And the origin O for hyperbolic plane can be set anywhere you like, and the graphs never change.
. And the origin O for hyperbolic plane can be set anywhere you like, and the graphs never change.
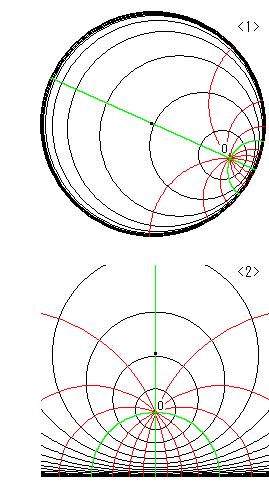
See the figure right. <1> is Poincare disk and <2> is upper halfplane. We are already familiar with these pictures, but pay attention to that either origin O is freely chosen. The black spot on the green perpendicular in upperhalf plane <2> corresponds to the center of Poincare disk. Curved lines are concentric circles with regular hiperbolic intervals and rays (straight lines) with angle intervals of 30![]() .
.
[2] Let us draw the length of circumference just as it is with arc or spiral.
![]() : It is drawn on an ordinary plane at regular intervals of spherical radii Rc up to the equator. The length
: It is drawn on an ordinary plane at regular intervals of spherical radii Rc up to the equator. The length ![]() of arc is the original length of circumference that depends on the radius Rc. The sky blue curve is the locus of the tip of arc when Rc is continuously changed. The arrow indicates the extending direction of the locus.
of arc is the original length of circumference that depends on the radius Rc. The sky blue curve is the locus of the tip of arc when Rc is continuously changed. The arrow indicates the extending direction of the locus.
![]() : Similarly, hyperbolic arcs
: Similarly, hyperbolic arcs ![]() are drawn. This time, they are actually spirals rather than arcs. They are drawn as hyperbolic length as it is. The sky blue curve expands counterclockwise contrary to
are drawn. This time, they are actually spirals rather than arcs. They are drawn as hyperbolic length as it is. The sky blue curve expands counterclockwise contrary to ![]() .
.
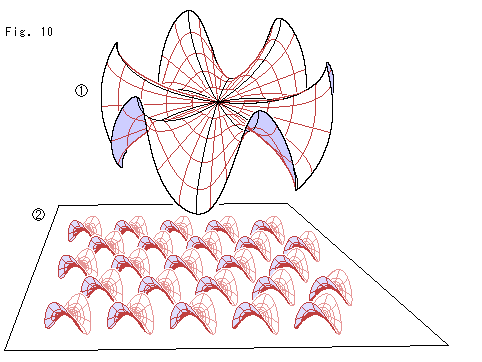
Look at Fig. 10.
We expand the spirals in the direction of circumference so that they become closed circles.
![]() : Then we get a saddlelike surface. We saw similar articles before. But this kind of surface is not true hyperbolic surface. The accurate one is that Beltrami's pseudosphere. Though it is true, our waved surface displays the pose of antisphere very well. Why so strange? Because we applied the weight of formula (13) that breaks the Pythagorean theorem.
: Then we get a saddlelike surface. We saw similar articles before. But this kind of surface is not true hyperbolic surface. The accurate one is that Beltrami's pseudosphere. Though it is true, our waved surface displays the pose of antisphere very well. Why so strange? Because we applied the weight of formula (13) that breaks the Pythagorean theorem.
![]() : It shows a comical or notional situation in hyperbolic plane. Now we realize that what is called a model is really wonderful. It accurately shows such a comical matters on an ordinary plane. How wonderful!
: It shows a comical or notional situation in hyperbolic plane. Now we realize that what is called a model is really wonderful. It accurately shows such a comical matters on an ordinary plane. How wonderful!
Thus we considerably found out the difference between formulae (12) and (13). However, it was followed by that we knew the latter is for hyperbolic plane. Let us see the difference between formulae themselves.
We can rewrite formula (12) in polar coordinates as

Similarly we rewrite formula (13), and let ![]() be constant (d
be constant (d![]() = 0), and we move a point along a straight line. Formulae (12) and (13) become
= 0), and we move a point along a straight line. Formulae (12) and (13) become
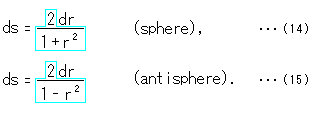
respectively. Then, we can easily integrate them. The sky blue frames show weight W.
Lengths S from the origin O are

The difference between these two expressions is only with "h" or without it.
Now let us see the differences between Poincare's disk (plane with inverse-spherical character) and an ordinary sphere.
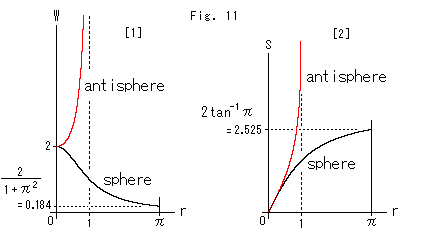
Look at Fig. 11.
The black curve is for the sphere and the red curve is for Poincare's disk (antisphere).
[1] shows how weight W changes. Weight W on the sphere gradually decreases and stops at the point as shown with the black curve. On the other hand, weight on Poincare's disk rapidly and unlimitedly increases as shown with the red curve.
[2] shows how length S from the origin O changes. Both red and black curves go up. They look symmetrical. But the black curve stops at the point as shown.
Remember that these graphs never change wherever the origin O is set.
By the way, see the denominator of expressions (14) and (15). We realize that the former will be the latter if we replace r in the former with imaginary number ![]() r. However, it does not mean what they call "hyperbolic geometry is a geometry on imaginary sphere". Because we handled only the denominator. We will see it later.
r. However, it does not mean what they call "hyperbolic geometry is a geometry on imaginary sphere". Because we handled only the denominator. We will see it later.
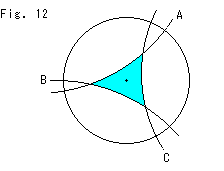
Look at Fig. 12.
What does "give hyperbolic structure" mean? We draw a circle with three circular arcs A, B and C on a sheet of paper. Every circular arc is perpendicular to the circle. We get the light blue concave triangle, as shown. Suppose the conditions (environment) given to the area inside the circle include the use of metric (13). Then the three circular arcs A, B and C are regarded as straight lines, and the light blue triangle is not distorted and "ordinarily" measured with metric (13). The result is that the sum of the interior angles is less than two right angles though all sides are straight. This is natural according to our story, but here we did not begin with Lobachevsky's parallel axiom. We optionally chose the metric.
Since we know that the resulting object will have hyperbolic geometry, it is what is called "giving hyperbolic structure" or the like.
Now we should realize that we can give hyperbolic structure to any object regardless of its substance. The study of substances is not to be a concern, according to Riemann's way of thinking. ("any object" usually means smooth surfaces or the like.)
It is not too difficult for us to understand that we do not need to worry about substance. However, we have used the expression "inverse-sphere" to indicate the substance. It is based on a thought as follows.
Suppose we look a world map. We know that the upper and lower areas on the map are actually shrunk, and we look at the map with this knowledge. But we cannot get a grasp of its reality in the way we could if we held a globe in our hands. If we have a globe, it is easy to understand not only the spherical map but also the actual globe, which is substantive.
A model of the Hyperbolic Non-Euclidean world is a kind of map. Therefore, it helps us if we have a hyperbolic globe. It helps us greatly. We want to get such a globe. Let's try our best to get one. We might find something.
It may be OK if we call a hyperbolic plane a hyperbolic plane, but if we have a name for a concrete substance, it helps our thinking. "Inverse-sphere" is a word we coined.
Lobachevsky and J. Bolyai discovered a mysterious phenomenon. Therefore, it was questioned whether it is true or not. Following Riemann's idea, however, when we actively create a mysterious matter, it is naturally mysterious. There is nothing unreasonable about it, and one of the results is hyperbolic geometry. That's all.
Anyway, people have accepted hyperbolic geometry through models supported by metric. And Riemann wiped away the mystery of the Hyperbolic Non-Euclidean World, not perfectly, but practically.