Pythagorean theorem does not stand in hyperbolic geometry, so that we can not use the technique of analytic geometry at all. Isn't it inconvenient?
Let us draw a curve by imitating analytic geometry though we know it is wrong, and see how it appears.
Analytic curves we draw in a hyperbolic model are not true, so let us call them with prefix "pseudo", for example a pseudo-quadratic curve. But we commonly use words that we here treat as corresponding matters to Euclidean geometry, such as "focus", "directrix", "asymptote" and so on.
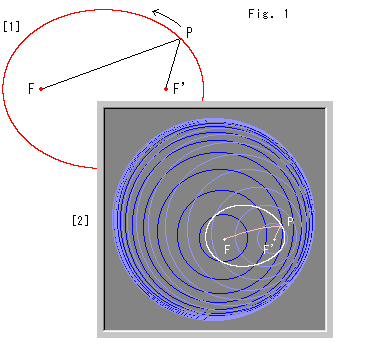
Look at Fig. 1.
[1]: It is one of ways we get an ellipse in Eulidean plane. We can get the red ellipse by moving point P while keeping sum S of focus distances PF and PF' constant. That is,
S = PF + PF' ![]() (1) .
(1) .
[2]: The white curve is a pseudo-ellipse which satisfies formula (1) on Poincare disk. That is to say the way of drawing is the same as [1]. The center of dark blue concentric circles is focus F and the center of dull blue concentric circles is focus F' .
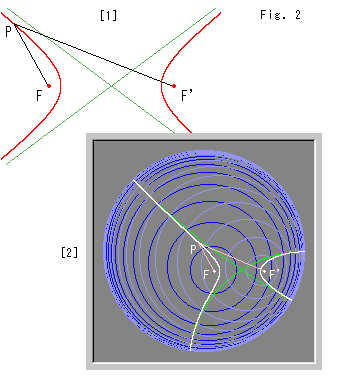
Look at Fig. 2.
[1]: It ia a hyperbola in Euclidean plane. We use point P, focuses F and F' similar to Fig. 1. The difference D between distances PF and PF' is constant. That is,
D = ![]() PF - PF'
PF - PF'![]()
![]() (2).
(2).
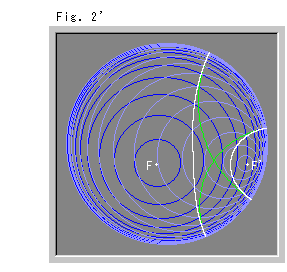
[2]: The white curve is a pseudo-hyperbola which satisfies formula (2) on Poincare disk. The green lines are asymptotes. (The pink lines PF and PF' look almost straight. It is because they pass near the origin.)
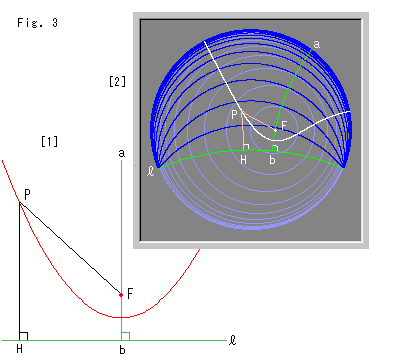
Look at Fig. 3.
[1]: It ia a parabola in Euclidean plane. Straight line ab is the axis, and straight line ![]() is the directrix. The formula we use:
is the directrix. The formula we use:
where PH is the distance between point P and the directrix ![]() , and PF is distance between point P and focus F.
[2]: The white curve is a pseudo-parabola which satisfies formula (3) on Poincare disk. The blue curves are equidistant lines with respect to directrix
, and PF is distance between point P and focus F.
[2]: The white curve is a pseudo-parabola which satisfies formula (3) on Poincare disk. The blue curves are equidistant lines with respect to directrix ![]() . The dull blue circles are concentric curves with the center at focus F.
. The dull blue circles are concentric curves with the center at focus F.
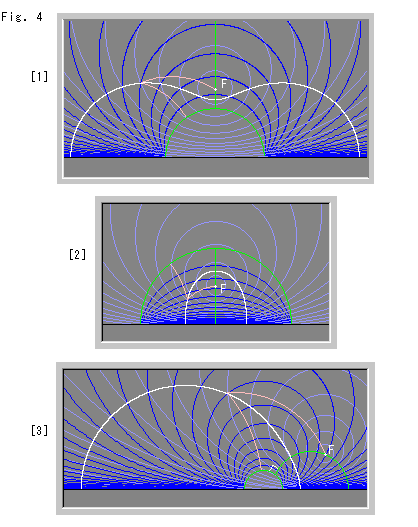
Look at Fig. 4.
This time, we use the upper half-plane ![]() . The horizontal black line is its X-axis. Every white curve is a pseudo-parabola drawn in the same way as [2] of Fig. 3, and it goes not up but down to X-axis.
. The horizontal black line is its X-axis. Every white curve is a pseudo-parabola drawn in the same way as [2] of Fig. 3, and it goes not up but down to X-axis.
[1]: The green semicircle is the directrix. Focus F is set right up of the directrix. The green vertical line is the axis of pseudo-parabola.
[2]: The axis of pseudo-parabola is the vertical straight line set at the center of semicircle of the directrix. And focus F is located as shown.
[3]: We shifted focus F to the right. The shape of pseudo-parabola is not a semicircle but slightly pressed from upper right. And both sides of it vertically end to X-axis.
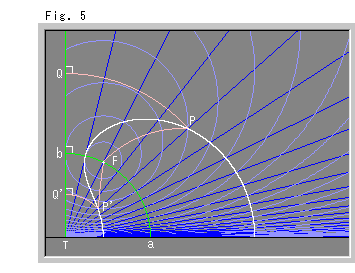
Look at Fig. 5.
Now the directrix is perpendicular to X-axis of the upper half-plane ![]() . Green straight line QT is the directrix, and green circular arc a-F-b is the axis of pseudo-parabola. Foot T of the directrix is the center of three circular arcs PQ, a-F-b and P'Q'. Needless to say, PF = PQ and P'F = P'Q'. In the figure PF = P'F', so that four lengths of pink arcs satisfies QP = PF = FP' = P'Q'. Both sides of the pseudo-parabola vertically end to X-axis, too.
. Green straight line QT is the directrix, and green circular arc a-F-b is the axis of pseudo-parabola. Foot T of the directrix is the center of three circular arcs PQ, a-F-b and P'Q'. Needless to say, PF = PQ and P'F = P'Q'. In the figure PF = P'F', so that four lengths of pink arcs satisfies QP = PF = FP' = P'Q'. Both sides of the pseudo-parabola vertically end to X-axis, too.
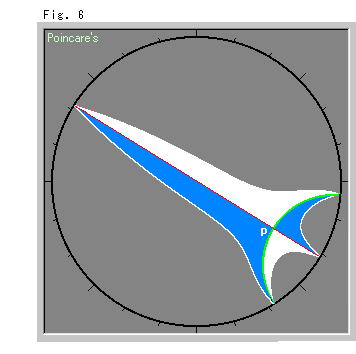
Let us see pseudo-qurdratic curves in connection with what is called Lambert's quadrangle. Fig. 6 right looks like a rocket flying through space, doesn't it? This rocket is drawn using Lambert's quadrangle.
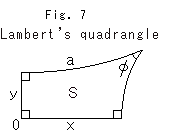
Fig. 7 is Lambert's quadrangle drawn on Poincare disk with one of vertices at the origin O. The relations among angle ![]() , sides a, x, y and area S are
, sides a, x, y and area S are

Length and area are in hyperbolic values, of course. As to hyperbolic functions (sinh, cosh), we will see in chapter 29. And here you can guess that they are brothers and sisters of sine and cosine greater than 1 sometimes.
Area S is defined by angle ![]() only. We move x and y while keeping S constant.
only. We move x and y while keeping S constant.
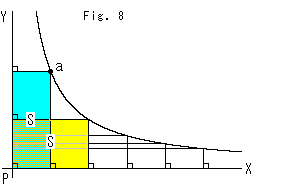
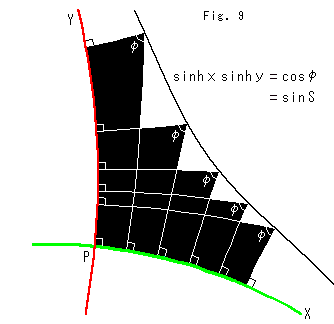
Fig. 8 is a hyperbola in Euclidean plane. As you know, area S is always constant wherever point P is located on the hyperbola. We are going to do the same thing in hyperbolick plane.
Look at Fig. 9
The black line is a pseudo-hyperbola in Poincare disk. Green straight line PX and red straight line PY are orthgonal asymptotes. Lambert's quadrangles are laid on asymptote PX at regular intarvals. As angle ![]() is constant, so that the area of every Lambert's quadrangle is constant, too.
is constant, so that the area of every Lambert's quadrangle is constant, too.
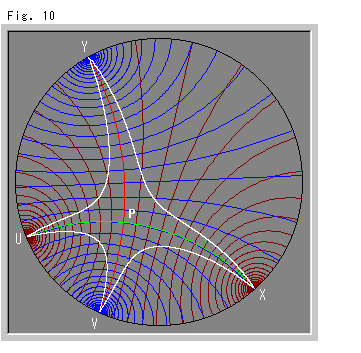
Look at Fig. 10.
All of four branches of a pseudo-hyperbola are drawn. Every blue straight line (circular arc) is perpendicular to the red asymptote. Every brown straight line (circular arc) is perpendicular to the green asymptote. Namely blue and brown straight lines are two groups of ultra parallel lines with respect to asymptoes. Ultra parallel lines are drawn at regular intervals along each asymptote.
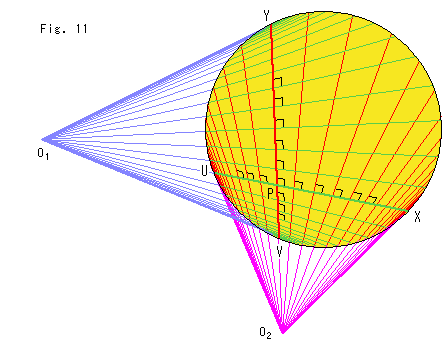
We will refer to symbols U, V, X and Y from Fig. 11 next. (We can get the rocket of Fig. 6 if we set one of asymptotes to pass the origin.)
Look at Fig.11.
Let us use Klein's disk to see what ultra parallel lines in Fig. 10 are. Lines in the yellow disk are equivalent to those of Fig. 10 excluding the pseudo-hyperbola. Straight lines ![]() Y and
Y and ![]() V are tangents to the yellow disk. All rays from point
V are tangents to the yellow disk. All rays from point ![]() cut chord VY in right angle. Similarly all rays from point
cut chord VY in right angle. Similarly all rays from point ![]() cut chord UX in right angle.
cut chord UX in right angle.
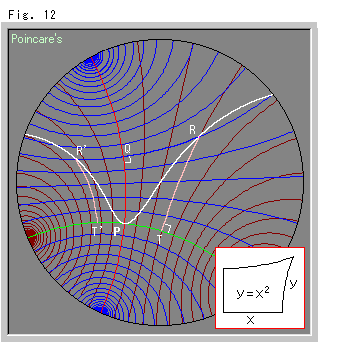
Look at Fig. 12.
We regard ultra parallel lines in Fig. 10 as if the XY-grid of Euclidean plane. The white curve is a pseudo-parabola. The formula here we use is
The left side of pseudo-parabola is on the same condition. And Both quadrangles PQRT and PQR'T' are Lambert's quadrangles. But distances along ultra parallel line QR and QR' are not equal.
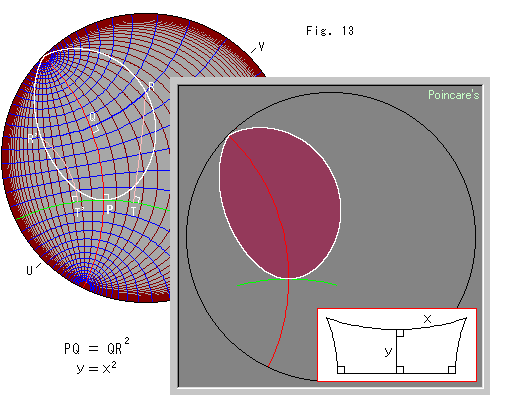
Look at Fig. 13.
This is a pseudo-parabola, too. The red arc is the axis of the pseudo-parabola. The green arc is perpendicular to the axis at point P that is the vertex of pseudo-parabola. The blue arcs are ultra parallel lines which are the same as those of Fig. 12 but the brown arcs are equidistant lines with respect to the red axis. We forcibly regard them as if the XY-grid of Euclidean plane though ultra parallel lines and equidistant lines are unbalanced concept. Formula we use here is a little different from that of Fig 12, and.
![]() .
.
And QR' = QR are kept.
As you see, we got a loop like a beautiful leaf of autumn. Incidentally the quadrangle RR'T'T formed with two Lambert's quadrangles back to back is called Saccheri's quadrangle.
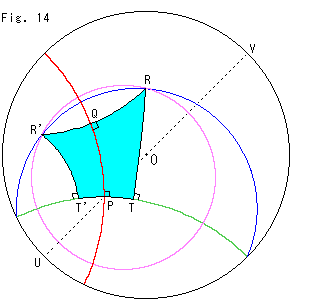
Look at Fig. 14.
In Fig. 13 the green and red arcs were intentionally drawn in symmetry with respect to diameter UV. Therefore Two Lambert's quadrangles PQRT and PQR'T' are congruent, so that Point R and point R' are on the hyperbolic circle with center P as shown. In case the green and red arcs are not symmetry, Lambert's quadrangles PQRT and PQR'T' are not congruent even if QR' = QR.
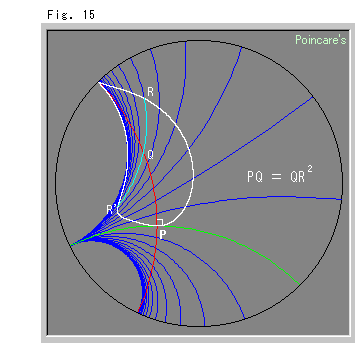
Look at Fig. 15.
This distorted white curve is also a pseudo-parabola. The blue arcs are hyperbolic paralle lines with the green line. They cut the red axis of the pseudo-parabola at regular intervals. The distances QR and QR' along the parallel line are kep equal; QR = QR'. The pseudo-parabola is sharpened this time.
We used the red circular arc as the axis of pseudo-parabola but it would be interesting if we use the horocycle that passes the common point of the parallel lines.
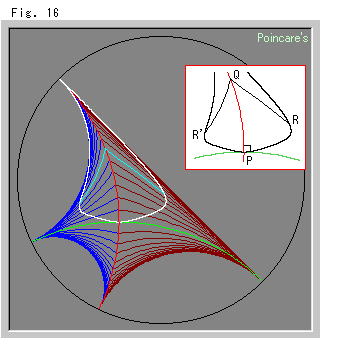
Look at Fig. 16.
In Fig. 15 there are parallel lines both sides of the red axis. So we draw this Fig. 16. Let us omit the explanation of this Fig. 16.
We can draw pseudo-curves as many as we want. But it is worth little to continue. So let's leave it. You might say that what we have done here is silly plays. But we learned that situation in the hyperbolic non-Euclidean World is so much different from the Euclidean World.
By the way, all books related hyperbolic geometry describe only about straight lines and circles as far as curves on the hyperbolic plane are concerned. We can fined no curve with name except a circle. So then we ourselves want to talk;
"there is a curve on the hyperbolic plane. Its charactor is such and such..."
Let us keep it for our promlem.